

One of the limitations of this model is that the generated precipitation time series generated by the model doesn't account for long-term drought cycles. Using the National Integrated Drought Information System (by NOAA), we can apply the Standardized Precipitation Index (SPI) to precipitation generated by WGEN to account for droughts. This blog post summarizes an approach used to incorporate droughts for a site during the years 1910 - 2022 and found to produce results that compare well to the historic precipitation measured at a site in Manti, Utah.
 for Manti, Utah")


This validation process revealed that the drought-induced precipitation generated by GoldSim compares well to the historical measured precipitation. This gives some confidence that the approach used in this model could be applied to other sites. Below are a couple of example charts from the validation section of this model. Note that because WGEN produces probabilistic results, we should expect some differences for a single realization run but the results should be similar.
The first step of the process to implement droughts is to obtain SPI values from the National Integrated Drought Information System website. This data was obtained by searching for a location that we can also find precipitation data during a similar time frame. For this application, I used Manti, Utah with a time frame of 1900 through 2022. Below is a chart showing the time history of SPI values generated in GoldSim.
 for Manti, Utah")
For descriptions of the wet and drought categories (W0-D4), refer to https://www.drought.gov/.
The next step is to compare the SPI values to measured precipitation for a similar location. Precipitation data was obtained from NOAA's National Centers for Environmental Information website. Below is a Time History result chart showing how precipitation compares to SPI. I am using the 1-year running average precipitation for this comparison. To simplify the SPI comparison, the mean of all the category values is calculated and this is the red dashed line shown in the chart below. The mean SPI is what I end up applying to the probabilistic precipitation data generated by WGEN.

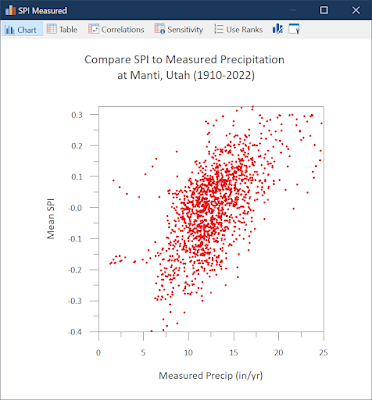
Using a Submodel in GoldSim, we can further evaluate this comparison with a multi-variate correlation chart. This is done by walking over the pairs of time series data where each realization of a Monte Carlo simulation represents each time step of the time series, thus producing the scatter plot shown below.

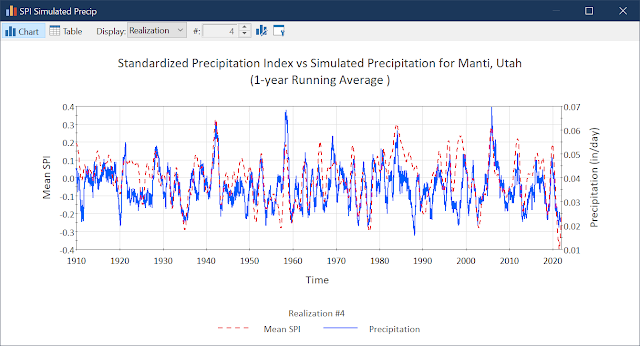
The correlation coefficient for SPI vs measured precipitation, which is automatically calculated by GoldSim's Multi-Variate Chart, is found to be 0.615 for this location. The next step was to apply the SPI factors to the probabilistic precipitation generated by WGEN for this site and calculate the same correlation for SPI vs simulated precipitation. After applying the SPI factors and running WGEN for a single realization, it generates a plot that seems to show somewhat similar results as the measured time series shown above. This is because WGEN relies on historical climate data as inputs, as described our WGEN PAR library model article. Below is the Time History chart generated by GoldSim using WGEN for this site with the SPI factors being applied.

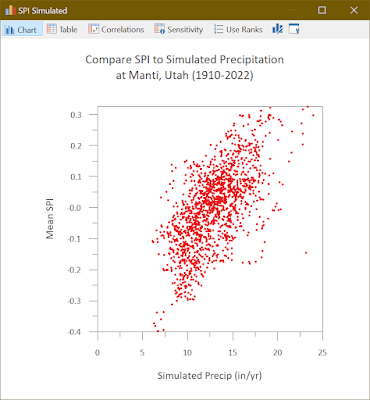
The correlation between Mean SPI and simulated (probabilistic) precipitation was also evaluated for a single realization in GoldSim and the scatter chart is shown below.

The correlation coefficient for mean SPI vs simulated precipitation for 1 realization is 0.632, which is similar to the measured precipitation correlation described above. This is not surprising since WGEN uses historical climate data as input. Running WGEN for multiple realizations shows that the mean of these multiple realizations more closely matches SPI, which is expected. In the plot below, I compare the mean of 10 realizations and use a 5-year running average.

In addition to the above correlation comparisons, the simulated drought-impacted precipitation time series generated by this new version of WGEN was further evaluated by comparing aspects of the data using some basic validation functions. I compare the following features of the simulated precipitation and compare it to the measured historical data on a monthly basis over the period of 1910-2022:
- Cumulative
- Peak
- Duration of significant rainfall intensity
- Duration of wet days


The next step is to build a model that can produce probabilistic SPI values based on the historical values presented on the National Integrated Drought Information System website in order to forecast with uncertainty.
If you would like to view the model, you can download it from here. If you have questions, please contact GoldSim Support.
No comments:
Post a Comment